Three years and two months after it launched on Kickstarter, copies of social deduction game Blood on the Clocktower are finally arriving in the UK. During the long wait eager players have been able to backstab each other using print-and-play copies and the online helper (particularly welcome during lockdowns). But it’s nice to have the real thing in our hands. I’m here to commemorate the occassion with statistics, and in particular to show the ranking system I’m using to see how well my players are doing – just for fun, of course.
In Clocktower a small team of evil players is secretly bumping people off, one by one. The good majority must find those traitors before everyone is dead. Everyone claims to be good, of course, but subtle inconsistencies (or brazen fibs) in the group’s information will arouse suspicions. If the good team lynches the Demon, head of the evil team, in time, they win; otherwise, evil does. Winning a great game of Clocktower will truly make you feel like Sherlock Holmes (or perhaps Moriarty).
Modelling the game statistically can help us with two related goals. Firstly, we can learn about players and how good they are (or aren’t) at the game, as with Elo ratings in chess. Secondly, and perhaps more interestingly, we can learn about the game itself. Are the good and evil teams balanced? Is it, in fact, a game of skill, or is the outcome a coin flip? What effect does the storyteller (who runs the game) have on the outcome – are some moderators better at balancing the game than others?
The Clocktower IQ repo explains how to run the model on your own data, and there’s plenty of technical detail below, but I’ll try to explain the idea as straightforwardly as possible.
We assume that all players have some underlying skill level, which we call your “Clocktower IQ”. If you plotted everyone’s skill you’d get a bell curve like the following:
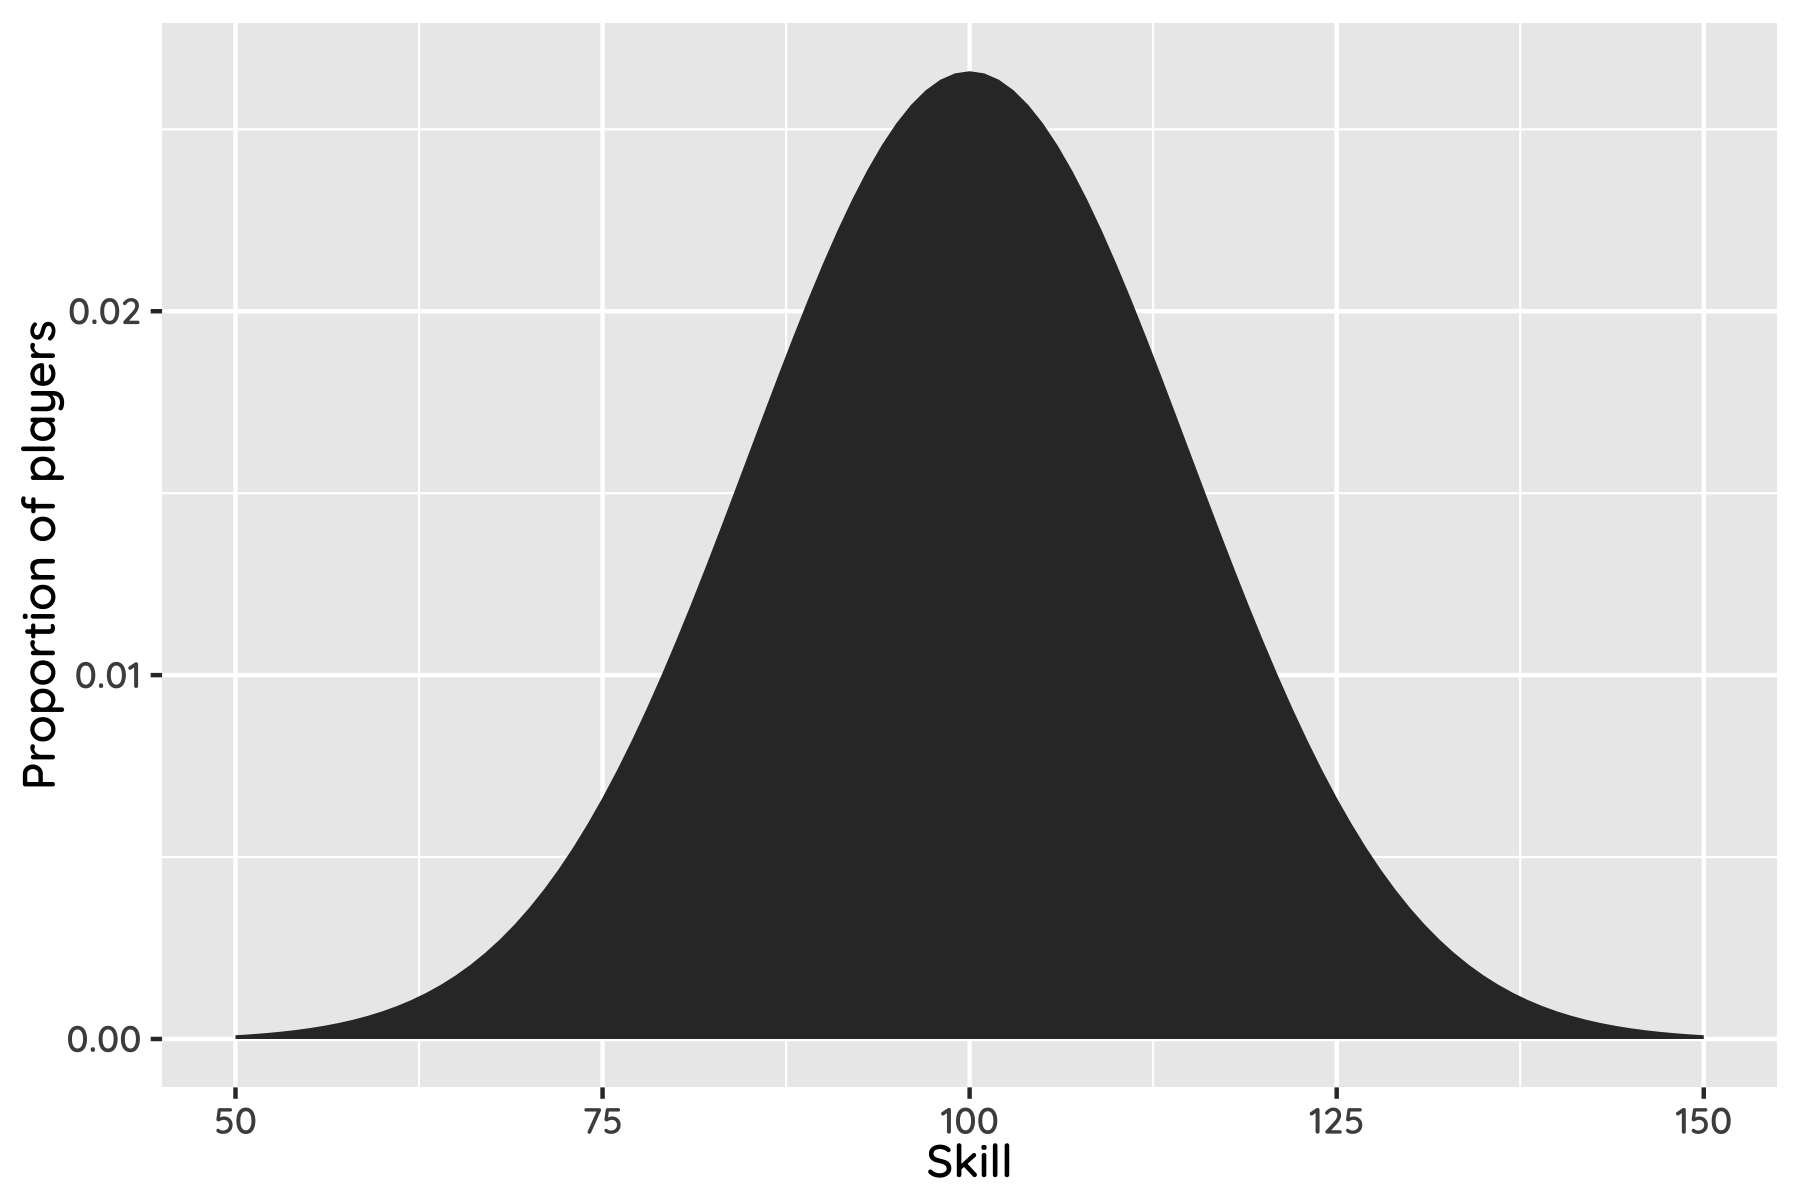
By definition, about two thirds of people have skill levels between 85 and 115. If your clocktower IQ is larger than 130 you’re allowed into Clocktower Mensa, and if it’s higher than 145 you’re a bona fide Clocktower Genius.
Although your skill is constant, your performance is not; a player with 120 skill might have a bum game and play like a 110, or really pull it out and hit a 130. The performance of your team is the average performance of the players, and the team with overall better performance wins. Separating “performance” from “skill” adds some uncertainty, allowing the worse team to win occasionally.
We don’t directly know players’ skill levels or how well they performed, but we do know who played on what team, and whether good or evil won. Using Bayesian magic we can work backwards from those results and infer player skill levels. And then if, hypothetically speaking, someone creates an illicit Clocktower betting market, you’ll know who to side with.
Here’s how the (anonymised) results look for our current group, for players of 5 or more games, with 95% confidence intervals.
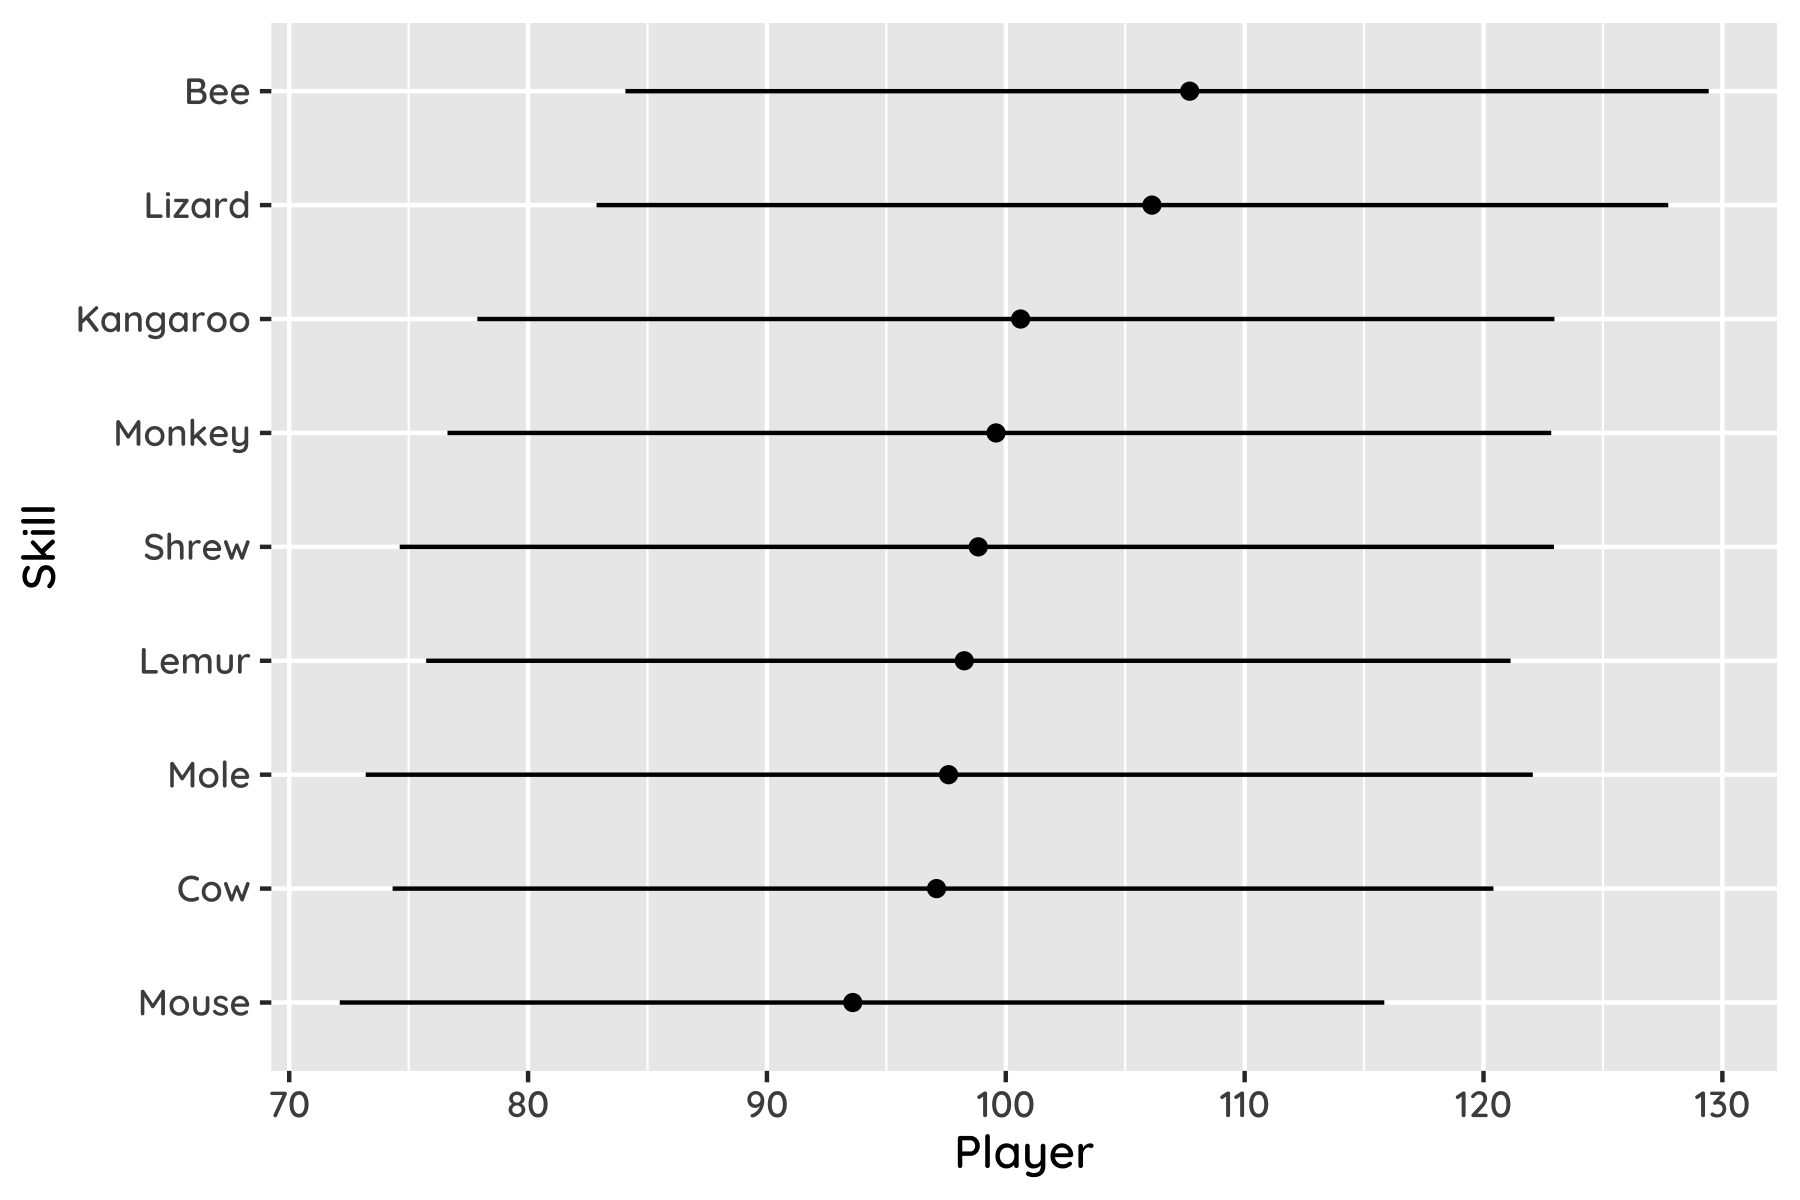
What’s really neat is the way this system can assign credit. Say a player won eight out of ten games. They must be pretty good, right? But if they won only when playing with really good players, and lost when playing with poor ones, that suggests they are not having much impact – they are not as good as they first looked. The model will recognise this, building up a consistent interpretation from the information available.
This is smart; not for nothing is a similar system used to match players on Xbox Live. But it’s nonetheless a bit limited by the data we have (currently only 24 games). Each round takes over an hour and provides only one bit of information. And the big group means that there’s often a new player each time, so we have almost as many parameters as data points. So, everything comes with big error bars – we’re only 80% sure the top player is actually better than the bottom one, for example. Scraping the official streams might be one way to resolve this.
Murder on the Dancefloor
The skill of player is follows a normal distribution, . (Above I used , in analogy to IQ, but this is a cosmetic difference that we can fix up later.)
The skill of a set of players is given by . Rather than modelling player-level performance, we can define the skill difference between teams G and E, , and skip to the team performance difference , where controls skill vs chance.[1] If , good wins, otherwise evil wins. This amounts to a souped-up probit regression.
That’s pretty much it. We can investigate whether the game is skillful by comparing model evidence: the approach above vs a simple coin-flip model. The skill model is preferred by a hair, with a 52% chance of being better based on the data we have. Not overwhemingly convincing, but given that the model has quite a few parameters (which the model evidence metric punishes), it says something that it’s not considered unlikely.
Assuming skill matters, on average the model predicts that the better team will win 55% of the time. That puts a rough lower bound on the edge the better team can expect to have, if it has one at all.
One thing we can rule out with some confidence is that the better team always wins, ie and . This is technically possible, but about 100 times less likely than either the performance-based or random models.
The high parameter:data ratio of the model means that maximum likelihood methods would certainly overfit, but in a Bayesian setting our posterior simply ends up being similar to the prior, with appropriately wide uncertainties (as reflected in its inconclusive results). We can reduce the number of parameters by filtering out players of very few games, either by treating them as a collective “other” player or by fixing their team contributions to 0. Interestingly, neither option improves the model evidence, so for now this seems unnecessary.
Is the game biased towards either side? We can test this by adding a bias term, where . Not surprisingly, given that evil won two-thirds of our games, the evidence says there’s a 60% chance of a bias. I suspect evil may have an advantage in novice games, if chance alone didn’t skew this result.
I’ve assumed that players have the same skill whether playing good or evil. Of course, some might be better logicians and worse liars, or vice versa. It would be interesting to model separate good/evil team skills (presumably with some correlation between them), but it’s doubtful that the current dataset could meaningfully support this. The same applies to changes in player skill over time.
Character roles are also excluded, for now. Aside from data-hungriness, it’s significantly harder to record and model roles in the first place, especially when players can switch during a game.
Finally, what is the impact of the storyteller? It’s easy to apply per-person biases to test whether moderators play favourites. More interesting is to check whether they are effectively balancing teams of disparate skill. If so, a game with a novice and expert team will nonetheless be quite uncertain; the storyteller has increased . Unfortunately it’s quite difficult to implement this variation in Infer.net, the tool I’m using for inference, so the idea will have to wait.
Early days. Even though it’s early to draw conclusions, I’m hoping that releasing the tool will encourage others to play with it and record more data. Enjoy.
Strictly speaking this is a little different to per-player performance, in that larger teams don’t perform more consistently. We can fix this by multiplying by , where and are the team sizes. ↩︎